Introduction
Contact center managers face an unrelenting operational reality: agents are expected to instantly recall policies, troubleshoot technical issues, and guide customers through complex procedures — all while a live customer waits on the line. Agents handle 30 to 60 calls per day, and 77% report that workloads have grown increasingly complex.
The root cause isn't a lack of knowledge — it's how that knowledge is delivered. Research shows that 41% of agents consult 4-5 different knowledge sources during a single customer interaction. When agents must navigate text-heavy manuals, disconnected systems, and dense policy documents under live-call pressure, even a well-built knowledge base fails.
Visual formats change that equation. Decision trees, flowcharts, annotated guides, and step-by-step visual SOPs give agents information they can act on immediately — without breaking call flow to hunt through documents. This article covers why visuals improve retention and recall, and how that translates to faster handle times, stronger first-call resolution, and shorter ramp-up cycles for new hires.
TL;DR
- Visual formats like decision trees and flowcharts allow agents to process information 20–50x faster than text, cutting search time during live interactions
- Dual-coding theory shows visually presented content creates stronger memory pathways, counteracting the 70% knowledge decay agents experience within 24 hours of training
- Interactive decision trees standardise resolution paths, lifting FCR from the industry average of 69% to 80%+ with consistent answers across every agent
- Knowmax embeds visual knowledge into agent desktops, eliminating application-switching that inflates handle time
What Is Visual Knowledge Management?
Visual knowledge management is the practice of structuring and delivering organisational knowledge using visual formats — flowcharts, decision trees, step-by-step visual guides, and annotated diagrams — rather than relying solely on text-based documents or written SOPs.
In contact centers, it applies during:
- Agent training – visual onboarding materials that accelerate retention
- Live call assistance – in-desktop guides agents reference during customer interactions
- Self-service troubleshooting – visual guides deployed in customer portals and chatbots
- Cross-channel support delivery – consistent visual content across web, mobile, and voice channels
Across all four scenarios, the goal is the same: knowledge that agents can find in seconds, process without re-reading, and act on without second-guessing — especially when a customer is waiting on the line.
Key Advantages of Visual Knowledge Management for Contact Center Agents
These advantages are rooted in how agents actually work: handling back-to-back queries under time pressure, often managing complex multi-step resolution paths. Each connects directly to metrics contact centers track.
Advantage 1: Faster Information Retrieval During Live Interactions
When agents handle live calls, they cannot afford to scroll through dense policy documents or long-form SOPs. Visual formats — especially flowcharts and step-by-step visual guides — allow agents to locate and follow the right resolution path in seconds.
How this works in practice:
A visual SOP with numbered steps and decision points eliminates ambiguity. Agents move through a resolution path without re-reading or second-guessing, even on unfamiliar issue types. A telecom agent troubleshooting a broadband connection follows a visual flowchart that branches based on symptom type, router model, and error code — no paragraph interpretation required.
The cognitive science behind it:
MIT research shows the brain processes images in as little as 13 milliseconds, compared to approximately 250 milliseconds per word. That's images processed 20–50 times faster than text.
Agents typically navigate 4–5 knowledge sources per interaction, and knowledge workers lose 1.8 hours per day searching for information. Visual formats that cut comprehension time per lookup compress handle time — interaction by interaction.
KPIs impacted:
- Average Handle Time (AHT)
- First Call Resolution (FCR)
- Agent confidence scores
- Escalation rates
When this advantage matters most:
- High-volume contact centers handling diverse query types
- Agents managing complex troubleshooting or multi-product environments where memorising every procedure isn't feasible
Advantage 2: Higher Knowledge Retention After Training
One of the most persistent challenges in contact center operations is knowledge decay. Agents learn procedures during onboarding, but without repeated exposure, retention drops quickly.
Why visual formats counteract decay:
Visual onboarding materials — annotated process maps, illustrated SOPs, visual scenario walkthroughs — give new agents cognitive anchors that text alone cannot provide. Allan Paivio's Dual-Coding Theory explains why: pictures are encoded into both verbal and imaginal memory systems simultaneously, while text typically generates only a verbal code. That dual encoding creates two retrieval paths, making pictures significantly easier to recall — and more resistant to decay.
The knowledge decay problem:
The Ebbinghaus forgetting curve, replicated in peer-reviewed research by Murre & Dros (2015), quantifies how rapidly untrained information is lost:
- 40% forgotten after 20 minutes
- 55% after 1 hour
- 70% after 24 hours
- 80% after 1 month
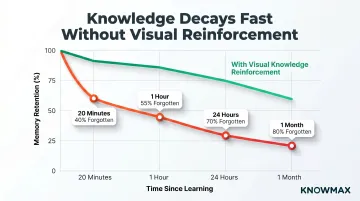
For contact centers running text-heavy onboarding programmes, this curve means most procedural knowledge is gone before an agent takes their first live call.
KPIs impacted:
- Time-to-proficiency
- Onboarding duration
- Error rates in early agent tenure
- Training cost per agent
When this advantage matters most:
- High-attrition environments where onboarding is frequent
- Contact centers managing seasonal volume spikes requiring rapid agent ramp-up
With 31.2% annual turnover and replacement costs of ₹8,30,000 to ₹16,60,000 per agent, visual knowledge tools that compress ramp-up time and reinforce retention directly offset these recurring costs.
Advantage 3: Consistent, Guided Resolution Through Visual Workflows
Inconsistency in resolutions — where two agents handling the same query give different answers — is one of the most damaging patterns in contact centers. 41% of consumers report receiving different answers from different agents, eroding trust and driving repeat contacts.
How visual decision trees work:
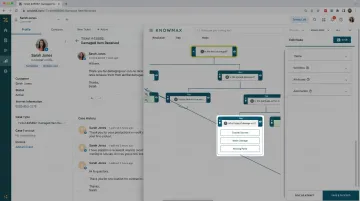
A visual decision tree works as a real-time guide. The agent answers a question, the tree branches to the next step, and the correct resolution is reached without relying on memory or judgment alone.
Knowmax supports this with interactive decision trees and a ready repository of 18,000+ device-specific guides for telecom and broadband environments — covering router setup, error code diagnosis, and connectivity troubleshooting through standardised visual workflows.
The financial impact of consistency:
SQM Group's 2025 benchmarking shows:
- Industry average FCR: 69%
- World-class FCR threshold: 80%+
- Only 5% of call centers reach world-class
- CSAT gap between first-call and 4+ call resolution: 47 percentage points
- Annual savings per 1% FCR improvement: $286,000
When every agent follows the same visual resolution path, FCR improves because issues are resolved correctly the first time. A 15% FCR improvement reduces repeat calls by 57%.
KPIs impacted:
- First Call Resolution (FCR)
- Customer Satisfaction (CSAT)
- Compliance adherence
- Repeat contact rate
When this advantage matters most:
- Regulated industries (banking, insurance, healthcare) where compliance with resolution procedures is mandatory
- Environments with high agent mix of tenured and new staff
What Happens When Visual Knowledge Management Is Missing
When knowledge is delivered purely through text, agents under pressure skip long documents, rely on memory, or ask colleagues — each creating inconsistency and delay.
eGain's 2017 survey of 2,000 agents found "finding the single right answer" is the top obstacle to excellent service. Meanwhile, 34% of consumers said agents simply do not know the answer.
The compounding consequences:
- Higher AHT as agents search across 4-5 disconnected sources
- More escalations when agents can't locate the correct procedure under pressure
- Higher error rates concentrated among newer agents still climbing the learning curve
- Rising re-training costs as knowledge decay goes unaddressed
These problems worsen as teams grow. What works when 10 agents know the processes by heart breaks down at 100 agents with varying tenure and product knowledge depth.
That scale comes with a steep price tag. A 100-agent center with 31.2% turnover replaces approximately 31 agents per year at a total cost exceeding $465,000 in training, recruiting, and lost productivity.
The nesting period — when new agents operate under supervision — most commonly lasts 1-2 weeks, though 11% of contact centers report nesting exceeding two months. This is right when the Ebbinghaus curve predicts 70% of training content has already decayed.
How to Get the Most Value from Visual Knowledge Management
Visual knowledge management delivers the most value when visual formats are embedded directly into the tools agents use during live interactions — not stored in a separate repository they have to navigate away to access.
Point-of-Need Access Beats Standalone Repositories
COPC Inc. (2025) identifies embedded knowledge integrations as a top-10 knowledge management best practice. AI-driven knowledge management embedded at the point of need achieves a 20-40% reduction in issue volume and 10-15% accuracy gains.
Standardise Visual Formats by Content Type
A mix of unstructured visuals and text creates its own cognitive load. Organisations should standardise visual formats by content type:
- Decision trees for troubleshooting
- Visual SOPs for processes
- Annotated guides for product-specific queries
This ensures agents know exactly what to expect and where to look.
Deploy Visual Knowledge Inside the Agent's Workspace
Knowmax enables contact centres to build, deploy, and maintain visual content — including interactive decision trees and visual troubleshooting guides — directly within the agent's workspace. The platform integrates natively with Salesforce, Zendesk, Freshdesk, and Genesys, so agents never leave their workflow to find answers.
The results are measurable: a leading online food delivery app achieved a 15% reduction in AHT, while a telecommunications company saw a 21% improvement in FCR using Knowmax's visual knowledge formats.
Guide Agents, Don't Script Them
McKinsey's research shows agents required to use rigid scripts exhibit higher stress and are more likely to leave, while satisfied agents are 8.5x more likely to stay. Visual decision trees that present options and relevant knowledge at each step empower agents without removing autonomy — that's the difference between guidance and constraint.
Conclusion
Visual knowledge management in contact centers is an operational advantage, not an aesthetic one. Visuals cut information retrieval time, lift post-training retention, and enforce resolution consistency across every agent interaction.
These gains reinforce each other. Agents who learn faster and recall more reliably — guided by visual workflows at the point of need — resolve issues more accurately and in less time. That difference registers directly in AHT, FCR, and CSAT.
With industry-average FCR sitting at 69%, $286,000 in annual savings per percentage point of improvement, and agent replacement costs exceeding $10,000 per hire, visual knowledge management is a structural investment in agent performance. It is not a content formatting preference.
Frequently Asked Questions
What is visual knowledge management?
Visual knowledge management is the practice of organizing and delivering organizational knowledge through visual formats such as flowcharts, decision trees, and annotated guides. It improves how quickly people can find, understand, and act on information compared to text-heavy documentation.
What tools and software are used for visual knowledge management?
Common tools include decision tree builders, visual SOP editors, and knowledge management platforms like Knowmax. The best tools integrate directly into agent workflows, embedded in CRM or agent desktop environments, rather than requiring agents to leave their workflow to find answers.
How does visual knowledge management improve agent performance in contact centers?
Visual formats reduce the time agents spend searching for information, improve retention of training content, and guide agents through consistent resolution paths. The result: lower AHT, higher FCR rates, and a measurable drop in resolution errors.
What types of visual content are most effective for contact center agents?
Decision trees for guided troubleshooting, visual SOPs for process steps, annotated product/device guides, and flowcharts for escalation paths are the most practically useful formats for agents handling live customer interactions.
How does visual knowledge management reduce Average Handle Time?
Visual formats allow agents to locate the relevant resolution path faster than scanning text documents. Guided visual workflows eliminate back-and-forth uncertainty during a call. Both directly shorten interaction duration.
How is visual knowledge management different from a traditional knowledge base?
A traditional text-based knowledge base stores searchable documents, articles, and FAQs. Visual knowledge management delivers guided, structured visual content that agents interact with in real time. The latter is designed for speed of application, not just storage of information.