Introduction
Many CX leaders face this exact scenario: leadership approves a conversational AI deployment, early results look promising, but when the CFO asks "what's the actual ROI?", there's no clear answer ready. This gap between implementation and proof represents the most common failure point in AI investments.
Conversational AI does deliver real operational and experience improvements. The problem is that the gulf between the technology working and proving it to stakeholders is where most teams lose credibility and budget.
According to Gartner, 77% of service leaders feel pressure from senior executives to deploy AI, but only 25% have fully integrated automation into daily operations. That 52-point gap means most teams are deploying AI without a reliable way to measure results.
This guide delivers a practical framework for identifying the right metrics, calculating conversational AI ROI, and communicating results in terms each stakeholder understands.
TLDR
- Establish baselines before deployment — without pre-deployment benchmarks, ROI claims are unverifiable
- Operational metrics (AHT, containment rate, cost-per-interaction) and CX metrics (CSAT, FCR, repeat contact rate) must be tracked together
- Translate metrics into stakeholder language: finance wants cost savings, CX leaders want retention data, operations wants capacity gains
- Soft ROI matters too: agent retention, 24/7 coverage, and churn reduction often outweigh direct cost savings
Why Measuring Conversational AI ROI Is Harder Than It Looks
The Vanity Metric Trap
Metrics like total deflection volume or chatbot session counts look impressive in presentations. They don't answer the question stakeholders actually care about: are we spending less, retaining more customers, or generating more revenue?
Traditional metrics like deflection rate reward throughput over outcomes. They obscure whether AI actually solves problems or just redirects them. Gartner recommends shifting from activity-based metrics (adoption rates, session counts) to outcome-based metrics tied to business value.
The Baseline Problem
That shift only works if you have something to measure against. Most teams deploy conversational AI first and measure later — making true before-and-after comparisons unreliable or impossible to defend in a finance review.
Establishing baselines before go-live is non-negotiable. You need documented benchmarks for:
- Cost-per-interaction
- Average Handle Time
- First Contact Resolution rate
- CSAT scores
- Total support costs
- Agent headcount
Without these numbers captured 60-90 days before deployment, your ROI calculation has no foundation.
Attribution Complexity in Hybrid Models
When AI works alongside human agents for escalation handling and knowledge retrieval, isolating its specific contribution to outcomes becomes genuinely difficult. 85% of service and support leaders are expanding human agent responsibilities alongside AI deployment, which only deepens the attribution challenge.
The fix: controlled routing comparisons. Route specific ticket types to AI while a comparable set continues with human handling. This creates a control group that satisfies even skeptical finance teams.
The Metrics That Actually Measure Conversational AI Value
Operational Efficiency Metrics
Three foundational KPIs anchor operational ROI:
1. Automated Resolution/Containment Rate
The percentage of queries fully resolved without human intervention. This metric directly translates to cost savings.
- Industry reality: Only 14% of customer issues resolve through traditional self-service
- AI-native platforms: 55-70% first contact resolution
- Target for mature deployments: 40-65% containment by week 12
Calculation: (Number of tickets resolved by AI without escalation ÷ Total tickets routed to AI) × 100
2. Average Handle Time (AHT) Reduction
Measures efficiency gains for human-assisted interactions after AI implementation.
- AI-native platforms achieve under 3 minutes AHT versus 4-7 minutes for traditional agent-assisted contacts
- Klarna case study: AI resolves queries in under 2 minutes versus 6 minutes for human agents
- One Knowmax customer reported a 15% reduction in AHT after implementation
Why it matters for ROI: Lower AHT means each agent handles more volume, reducing the cost-per-interaction without sacrificing quality.
3. First Contact Resolution (FCR)
Tracks how often issues resolve during the first interaction, regardless of channel.
- AI-native benchmarks: 55-70% FCR
- Vodafone SuperTOBi: Improved FCR from 15% to 60%
- A leading telecom using Knowmax achieved a 21% improvement in FCR
Cost-Per-Interaction Formula
This single comparison is often the most powerful data point for finance stakeholders:
Cost per interaction = Total support costs ÷ Resolved tickets
Segment by AI-handled versus human-handled interactions:
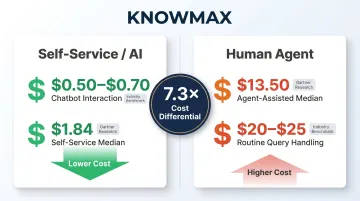
- Gartner benchmark: $1.84 median cost per self-service contact versus $13.50 per agent-assisted contact — a 7.3x differential
- AI chatbot: $0.50-$0.70 per interaction; human agent routine query: $20-$25
Use fully-loaded costs — salary, benefits, training, overhead, and technology — not just hourly rates. Hourly-only calculations significantly understate true savings.
Customer Experience Metrics
Operational costs tell half the story. Whether customers actually got help is the other half — and these metrics close that gap.
Segmented CSAT Scores
Always segment CSAT by resolution type: AI-only, human-assisted, and escalated. Aggregate CSAT can mask declining quality in AI-handled interactions.
A field study of 35,000 chatbot interactions at a telecom company found 66% of customers gave the lowest possible satisfaction rating (1 out of 5). Yet 92% of businesses self-report improved CSAT after implementing AI. That gap is the masking risk in action.
Track AI-only CSAT separately and set a quality floor — for example, a minimum of 3.5/5 — below which containment gains don't matter.
Repeat Contact Rate
Repeat contact rate is a leading indicator of resolution quality — track how often customers return with the same issue within 7 days of an AI interaction.
- Industry benchmark: 10-20% repeat contact rate, implying 80-90% resolve on first contact
- A rate above 20% typically signals the AI is deflecting rather than resolving — each repeat contact erodes the cost savings you're trying to prove
Metrics to Avoid
These are misleading:
- High deflection volume without segmentation — doesn't distinguish between quality resolution and customers giving up
- "Conversations handled" counts that include abandoned or zero-value sessions
- CSAT from voluntary surveys that skew toward extreme responders
Use controlled sampling and mandatory feedback collection for AI interactions instead.
Building Your Conversational AI ROI Calculation Framework
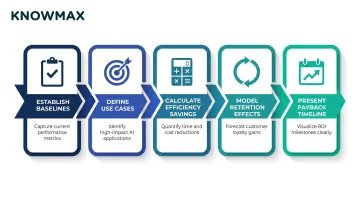
Step 1: Establish Pre-Deployment Baselines
Document these metrics 60-90 days before deployment:
- Current cost-per-interaction (fully-loaded)
- Average Handle Time
- First Contact Resolution rate
- CSAT scores by channel
- Total monthly support costs
- Agent headcount and utilization rates
Without these numbers, your ROI calculation is speculation, not measurement.
Step 2: Define Target Use Cases with Expected Automation Rates
Rather than projecting ROI across total ticket volume, identify specific high-volume, low-complexity ticket types:
- Billing inquiries
- Order status checks
- Password resets
- Return/refund policies
- Basic FAQs
Model expected containment rates for each. This makes calculations more defensible to skeptical stakeholders.
Example: If billing inquiries represent 18% of total volume and you project 65% containment, that's a concrete target to measure against.
Step 3: Calculate Direct Efficiency Savings
Formula: (Baseline fully-loaded cost per ticket × Number of tickets handled by AI) − AI platform costs = Direct cost savings
Fully-loaded cost includes:
- Salary and benefits
- Training and onboarding
- Technology and tools
- Facilities overhead
- Management and QA
For a team of 20 growing at 30% annually, AI deflection can save $240,000-$320,000/year by avoiding 4 additional hires at $60,000-$80,000 loaded cost each.
Step 4: Model Retention and Revenue Effects
Bain & Company research confirms that increasing customer retention rates by 5% increases profits by 25-95%. That relationship is what makes CSAT improvements measurable in revenue terms — not just satisfaction scores.
How to model it:
- Establish the relationship between CSAT and retention in your business (historical data)
- Project CSAT lift from AI deployment (use conservative estimates)
- Calculate expected churn reduction percentage
- Multiply by customer lifetime value to get retained revenue value
To anchor your projections, consider scale: Forrester reports that a single 1-point CX Index improvement can drive over $1 billion in additional revenue for a mass-market auto manufacturer, or close to $370 million for an auto/home insurer. Even a fraction of that impact justifies the investment case for most enterprise deployments.
Step 5: Present Payback Period and Phased Returns
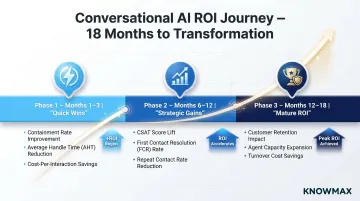
Create a simple timeline showing:
- Months 1-3 (Quick wins): Containment rate targets, AHT reduction, cost-per-interaction improvement
- Months 6-12 (Strategic gains): CSAT lift, FCR improvement, reduced repeat contact rate
- Months 12-18 (Mature ROI): Retention impact, agent capacity freed, reduced turnover costs
A phased timeline is more credible to finance and operations stakeholders than a single projected number — and it sets clear checkpoints for validating results as the deployment matures.
How to Present Conversational AI ROI to Different Stakeholders
The Core Principle
The same underlying data must be reframed for different stakeholders:
- CFOs need cost-per-interaction reductions and payback period
- VPs of CX need CSAT lift and retention metrics
- Operations leaders need AHT reduction and capacity-freed data
Example: A 20% AHT reduction translates to:
- Finance view: $180,000 annual savings by avoiding 2 new hires
- CX view: 20% more capacity to handle complex cases requiring empathy
- Operations view: Ability to absorb 25% volume growth without adding headcount
For Finance and Executive Stakeholders
Build a cost comparison model contrasting fully-loaded agent cost per interaction against AI-handled interaction cost.
Key framing: AI costs scale variably with volume while headcount costs are largely fixed. This is compelling for CFOs evaluating cost structures.
Gartner recommends five board-level metrics:
- Sales conversion rate
- Average labour cost per worker
- Time to value
- Collection efficiency index
- Employee NPS
Focus presentations on outcomes, not activities.
For CX and Customer Experience Stakeholders
Present CSAT improvements alongside containment rates to demonstrate quality wasn't sacrificed for efficiency.
Tie CSAT lift to retention models using industry benchmarks. Bain's NPS research shows that NPS leaders achieve 2× industry revenue growth and 20% reduction in customer attrition.
The Knowledge Accuracy Factor
One enabler stakeholders consistently overlook: the quality of the knowledge powering the AI. When conversational AI draws from outdated or fragmented sources, resolution accuracy drops, CSAT suffers, and the ROI case unravels.
Knowmax addresses this directly. Its structured content types — decision trees, FAQs, picture guides, and articles — combined with version control, real-time content updates, and authorization workflows prevent stale knowledge from degrading AI performance. Accurate answers, at volume, are what make ROI outcomes defensible in stakeholder reviews.
The ROI Dashboard Concept
Build a single-page stakeholder summary updated monthly:
- Total investment to date
- Key metrics versus pre-deployment baseline
- Direct cost savings (cumulative)
- CSAT change (segmented by resolution type)
- Payback progress
Consistent, recurring ROI reporting builds stakeholder confidence far more effectively than a one-time presentation. Knowmax's analytics module surfaces KPIs including FCR, AHT, content usage analytics, self-service metrics, and agent performance data — enabling CX leaders to build this kind of stakeholder summary every month.
Capturing the Full ROI Picture Beyond Cost Savings
Agent Satisfaction and Retention Value
Reduced repetitive task load lowers agent burnout and turnover. Replacing a customer service agent has measurable fully-loaded costs:
- SHRM reports average cost per hire of nearly $4,700, with total replacement cost (including onboarding and training) estimated at 3-4× the position's salary
- Gallup estimates replacing frontline employees costs approximately 40% of annual salary
- Contact center annual agent turnover: 30-45%
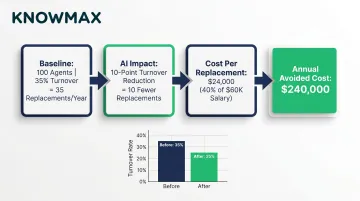
ROI calculation example:
- Baseline: 100-agent team, 35% annual turnover
- AI impact: 10-percentage-point turnover reduction = 10 fewer replacements per year
- Cost per replacement: $24,000 (40% of $60,000 salary)
- Annual avoided cost: $240,000
Knowmax's AI-assisted knowledge delivery reduces new agent ramp time and gives existing agents instant access to guided resolutions — directly addressing the repetitive workload that drives burnout.
24/7 Availability and Demand Elasticity Value
AI eliminates incremental staffing costs for after-hours coverage and handles peak volume spikes without overtime or outsourcing.
How to calculate:
- Estimate the cost of equivalent human coverage for after-hours (nights, weekends, holidays)
- Compare against incremental cost of AI handling that volume
- AI provides 4.6× more annual availability (8,760 hours versus 1,880 hours per human agent)
Knowmax-powered chatbot integrations support 24/7 self-service deployments. One telecom client handled 1.2 million transactions through chatbots with a 73% rate of transactions resolved without transfers — proof that AI absorbs after-hours and surge volume without adding headcount.
Brand, Trust, and Competitive Differentiation
The metrics above quantify direct cost impact. But there's a second tier of value — harder to measure, still real — in what consistent, fast service does to customer perception over time. Faster resolution and cross-channel consistency reduce customer effort, and that compounds into NPS improvement.
While harder to quantify, NPS improvements correlate with referral rates and organic growth. Forrester research shows that improving CX alone can lead to a 1.5× revenue lift.
When presenting to executives, frame these as modelled projections tied to NPS movement — even a 5-point NPS gain has a calculable referral and retention value that belongs in the business case.
Handling Common Stakeholder Objections to AI ROI Claims
"The AI keeps making mistakes — how can we trust the numbers?"
Response: Phased deployment with A/B comparisons generates defensible quality data.
Route specific ticket types to AI versus human handling to create controlled comparisons. Track resolution accuracy (not just containment) and implement escalation protocols as a safeguard.
Stale knowledge is one of the biggest drivers of AI errors — so the quality of your knowledge base matters as much as the AI itself. Knowmax addresses this with built-in governance workflows:
- Content review cycles with scheduled audits
- Ownership assignment per article or topic
- Version control to track changes over time
- Automated expiry alerts before content goes stale
These controls keep knowledge current and reduce the risk of the AI surfacing outdated answers.
"We can't prove it was the AI — results could be from other changes"
Use controlled pilot designs where AI handles one channel or ticket category while a comparable set continues with human handling.
Gartner recommends a 4-week initial AI assistant pilot to measure impact with a controlled comparison window. Target 40-65% containment by week 12 for pilot evaluation.
"The returns take too long to justify the investment"
Response: Identify fastest-ROI use cases first.
High-volume, low-complexity, predictable ticket types show measurable savings within 60-90 days:
- Order status checks
- Password resets
- Billing questions
- Return policies
Real examples:
- Klarna: AI handles two-thirds of customer chats (equivalent work of 700 agents), expected $40 million profit improvement
- Vodafone SuperTOBi: 70% reduction in cost-per-chat, NPS increased by 14 points
- Walmart: AI processes more than 70% of returns/refunds, cut handling times in half
Distinguish short-term efficiency ROI (60-90 days) from longer-term strategic ROI (retention, brand, scalability) and present both with separate timelines.
Frequently Asked Questions
Frequently Asked Questions
How is AI changing the ROI of customer service?
AI shifts customer service from a fixed-cost headcount model to a variable-cost model while simultaneously improving resolution speed and consistency. Cost-per-interaction reductions, CSAT improvements, and 24/7 availability combine to produce ROI across cost, retention, and revenue dimensions.
What is the 10 20 70 rule for AI?
The 10-20-70 rule, attributed to BCG (Boston Consulting Group), states that roughly 10% of AI value comes from algorithms, 20% from data and technology infrastructure, and 70% from people and processes. Teams that deploy conversational AI without redesigning workflows and training agents routinely leave the majority of that 70% on the table.
How long does it typically take to see ROI from conversational AI?
Operational efficiency gains (AHT, containment rate, cost-per-interaction) are typically visible within 60-90 days for well-scoped use cases. CSAT and retention improvements usually appear at 6-12 months. Establish baseline metrics before deployment — that data is what makes ROI provable, not just visible.
What metrics matter most when presenting conversational AI ROI to executives?
Cost-per-interaction reduction and payback period for finance stakeholders; CSAT improvement and churn reduction for CX leaders; AHT plus agent capacity freed for operations. The most compelling executive presentations connect all three into a single business impact summary.
What is the difference between hard ROI and soft ROI in conversational AI?
Hard ROI includes directly measurable cost reductions: cost-per-interaction, headcount efficiency, AHT savings. Soft ROI covers value that requires modelling rather than direct measurement — agent retention savings, brand trust, and customer lifetime value improvements tied to CSAT gains.
How do I calculate cost savings from conversational AI in customer service?
Start with your baseline fully-loaded cost per human-handled interaction (including benefits, training, and overhead — not just salary). Multiply that by the volume of interactions AI handles, then subtract AI platform costs. The result is your net savings figure.