Introduction
Contact center leaders face a persistent frustration: they've invested in a knowledge base, agents are using it, yet performance gains remain hard to prove—or hard to explain when they don't appear. The root problem is measurement. Most teams track downstream KPIs like Average Handle Time (AHT) and First Contact Resolution (FCR) without monitoring the knowledge base-specific health metrics that actually drive those outcomes.
That gap creates a measurement blind spot where KB investments get credited or blamed for results they may not actually control.
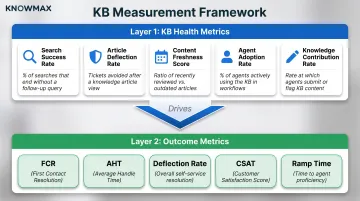
Closing that blind spot takes a two-layer measurement framework: KB health metrics that diagnose what's happening inside the knowledge base itself, and contact center outcome metrics that capture whether those internal improvements translate into operational gains. This article walks through both layers and shows you how to read them together.
TLDR
- KB health metrics diagnose tool functionality; outcome metrics prove performance impact—you need both
- Leading indicators to track: search success rate, article deflection, content freshness, agent adoption, and knowledge contribution
- FCR, AHT, ticket deflection, CSAT, and ramp time serve as lagging confirmation of KB effectiveness
- Pairing metrics reveals root causes — poor search plus rising AHT points to content gaps; low adoption plus high AHT points to usability failure
- Knowmax's analytics surface both metric tiers in one view, so teams can act on leading signals before lagging KPIs decline
Why Most Contact Centers Track the Wrong KB Metrics
Most teams default to vanity metrics that feel productive but reveal nothing about impact:
- Total articles published
- Page views or traffic volume
- System uptime percentage
- Number of active users
These activity indicators don't answer the critical question: Is the KB actually helping agents resolve issues faster or enabling customers to self-serve successfully?
The attribution gap exists because KB health metrics and contact center KPIs typically live in separate systems. Knowledge platforms track content usage, while CRMs and telephony systems measure operational performance.
Contact centers currently operate with an average of 3.9 disconnected systems, making it difficult to connect KB activity to business outcomes.
The Two-Tier Solution
Closing this gap requires tracking metrics across two layers:
- Layer 1 — KB Health Metrics: Diagnose content quality and usability — whether your knowledge base works as a practical tool for agents and customers.
- Layer 2 — Outcome Metrics: Capture what happens to contact center performance as a direct result of KB usage.
A KB that scores well on Layer 1 should predictably improve Layer 2 results. If it doesn't, there's a structural disconnect worth investigating. Content may be accurate but poorly formatted for live interactions, or technically correct but written in language agents can't use mid-call.
The KB Health Metrics That Diagnose Your Knowledge Base
Search Success Rate
Definition: Percentage of KB searches where users clicked a result, didn't immediately re-search with different terms, and didn't escalate to a ticket or call.
This metric is the earliest signal of KB effectiveness. When agents search but don't find useful answers, they're forced to consult colleagues, place customers on hold, or escalate unnecessarily. Industry benchmarks place acceptable search success rates at 70-80%.
Poor search performance directly costs time. Employees spend 21% of their workday searching for information and 14% recreating information that already exists. When agents wade through irrelevant results during live calls, hold times climb and customer frustration builds.
What drives search failure:
- Content gaps where articles don't exist for common queries
- Poor article titles that don't match how users phrase questions
- Keyword-based search that can't interpret intent
- Outdated content that appears in results but doesn't solve current issues
Platforms like Knowmax address this with AI-powered intent search that understands the meaning behind queries, not just keyword matches, surfacing relevant answers without requiring exact terminology.
Article Deflection Rate
Definition: Percentage of users who accessed a KB article and did not subsequently create a ticket or initiate a call.
Calculate it as: (sessions ending without a ticket / total sessions) × 100
This metric reveals whether your content actually resolves issues. Distinguish between:
- Agent-side deflection: Agent finds the answer without escalating to tier 2 or specialists
- Customer-side deflection: Customer self-serves without ever contacting support
Top-performing organizations achieve 20-40% ticket deflection rates, with customer preference strongly favoring self-service—67% of customers prefer self-service over speaking to a representative.
The inverse relationship is equally important: poor self-service experiences increase ticket volume by 25-40%. When customers can't find answers, they escalate to more expensive channels, compounding operational costs.
Content Freshness Score
Definition: Percentage of articles reviewed and confirmed accurate within your defined review cycle (typically quarterly).
Calculate it by tracking what portion of your content library has been audited within your standard timeframe.
Outdated content carries real costs. Inaccurate information costs organizations an estimated $12.9 million annually. In contact centers, stale content is particularly damaging.
An agent who delivers incorrect information based on an outdated article creates a worse outcome than having no KB at all. It destroys customer trust and generates follow-up contacts to correct the error.
When agents encounter outdated content repeatedly, they stop trusting the KB entirely and revert to informal workarounds — personal notes, messaging colleagues, or relying on memory. That erosion of trust compounds quickly.
Recommended review cadences:
- High-impact articles (top 20): Monthly
- Product-linked content: Quarterly, especially after releases
- General knowledge: Every 6-12 months
- Automated triggers: 90-180 days after publication
Organizations with structured review cycles spend 40% less time resolving information-related issues.
Knowmax supports configurable review cycles with expiry flags and automated scheduling, ensuring content never falls out of date without visibility.
Agent Adoption Rate
Definition: Percentage of agents actively querying the KB during live interactions over a measured period.
Low adoption despite a large content library signals a usability problem. The KB exists, but agents find it faster to rely on memory, colleagues, or personal notes.
60% of contact center agents lack the tools needed to deliver top-tier customer experiences. When agents avoid the KB, it's typically because:
- The KB is housed in a separate system requiring context-switching during calls
- Search is too slow or unreliable to trust during time-sensitive interactions
- Content is technically accurate but too complex to parse quickly
- Articles are text-heavy without visual aids or guided workflows
Knowmax integrates directly into agent desktops — embedding KB access within Salesforce, Zendesk, Genesys, and other CRMs so agents never leave their workflow. AI-powered search surfaces answers proactively based on call context, removing friction from the retrieval process.
Knowledge Contribution Rate
Definition: Volume of article edits, flags, or new submissions originating from frontline agents over a measured period.
A KB that agents never contribute to stagnates, while one with active participation evolves alongside real customer scenarios. This metric also serves as a proxy for agent engagement — when agents feel ownership of the knowledge system, adoption and accuracy both improve.
Industry frameworks like Knowledge-Centered Service (KCS) track:
- Valid articles created
- Articles modified
- Articles linked to resolved cases
- Duplicates flagged
Sufficient link rates fall between 60-80% of closed cases, with link accuracy thresholds of 90% or higher required for the reuse pattern to be reliable.
Knowmax enables agent contribution through feedback management workflows and approval chains, ensuring frontline insights flow back into content improvements without sacrificing accuracy.
The Contact Center Outcome Metrics Your KB Directly Moves
First Contact Resolution (FCR)
Definition: Percentage of customer issues resolved during the first interaction without requiring follow-up contacts.
The mechanism is straightforward: agents with immediate access to accurate, structured KB content (especially decision trees and guided troubleshooting flows) can resolve issues in a single interaction more consistently.
Benchmarks:
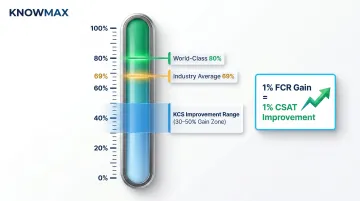
- Industry average: 69%
- World-class: 80%
- Range: 43-88% depending on industry
Teams adopting Knowledge-Centered Service see 30-50% FCR improvement, with every 1% FCR gain yielding a 1% improvement in customer satisfaction.
How to identify KB-driven FCR improvements: Track FCR trends before and after content updates for specific issue categories. If FCR for product setup questions jumps from 65% to 78% following the publication of visual setup guides, the KB contribution is clear.
Knowmax's decision trees and visual troubleshooting guides directly support FCR by transforming complex procedures into interactive, step-by-step workflows that agents can follow during live calls. One leading telecom company achieved a 21% FCR improvement after implementing Knowmax's guided resolution tools.
Average Handle Time (AHT)
Definition: Total talk time + hold time + after-call work, divided by number of calls handled.
Formula: AHT = (Total Talk Time + Total Hold Time + Total After-Call Work) / Number of Calls
Industry average: 6 minutes and 10 seconds
KB-driven AHT reduction comes from eliminating search time: the seconds agents spend switching tabs, consulting colleagues, or re-reading lengthy articles during live calls. Unlike training-driven AHT reduction (where agents memorize procedures), this scales instantly when new products or policies launch.
Implementing an integrated knowledge management system can lower AHT by 25% by removing the friction between question and answer.
That 25% reduction depends heavily on where the KB lives. When access is embedded directly in the agent desktop rather than requiring tab switches, time savings compound across thousands of daily interactions. Knowmax's CRM integrations surface answers contextually, so agents never need to break flow to query manually.
Call and Ticket Deflection Rate (Self-Service)
Definition: Volume of inbound contacts prevented entirely because customers successfully self-served via a customer-facing KB.
Zendesk self-service score formula: Total KB sessions / Total users who submitted tickets
Benchmarks:
- Baseline ratio: 4:1 (4 self-service sessions per ticket-submitting user)
- Strong performance: 40:1
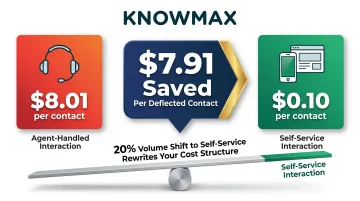
Agent-handled interactions cost $8.01 versus $0.10 for web/app self-service—a $7.91 savings per deflected contact. At scale, moving even 20% of volume to self-service rewrites the cost structure of a contact center operation.
Knowmax enables deflection through customer-facing portals, visual device guides, and chatbot integration, with some implementations deflecting 60% of tickets to self-service channels.
Customer Satisfaction Score (CSAT)
Definition: Percentage of customers rating their experience as satisfactory (typically measured via post-interaction survey).
KB quality influences CSAT indirectly but measurably. Consistent, accurate answers reduce customer effort — one of the strongest predictors of satisfaction.
Measuring satisfaction on customer journeys is 30% more predictive of overall CSAT than individual touchpoint scores. Even at 95% satisfaction per interaction, a six-touchpoint journey carries up to a 25% chance of a poor overall experience when inconsistencies appear.
When agent-assisted channels and self-service portals draw from different knowledge sources, customers receive contradictory information across touchpoints — and CSAT drops. A unified single source of truth is what turns KB investment into measurable satisfaction gains.
Knowmax ensures omnichannel consistency by serving the same centralised knowledge base to agents, self-service portals, chatbots, and mobile channels simultaneously.
New Agent Ramp Time
Definition: Time from an agent's first day to reaching target performance benchmarks (e.g., hitting FCR and AHT thresholds).
Industry benchmarks:
- Typical ramp time: 4-12 weeks depending on complexity
- Simple operations: 4-5 weeks
- Complex multi-system environments: 8-12 weeks
A well-structured KB with guided workflows and visual troubleshooting reduces ramp time because agents can look up procedures rather than memorize them. One organization cut agent ramp time by 75% by shifting from memorisation-based training to scenario-based documentation usage. New agents handled any call type in 15 days versus 60 previously.
KCS adopters see 70% faster time-to-proficiency for new analysts, with the added benefit that knowledge remains current as products and policies evolve—eliminating the constant retraining cycle.
Reading KB Metrics Together: Where the Real Insights Live
No single metric tells the full story. Genuine KB performance emerges when you analyse how Layer 1 (health) and Layer 2 (outcome) metrics move in relation to each other.
Diagnostic logic: When a Layer 1 metric is poor but a Layer 2 metric holds steady, the root cause lies elsewhere. When both deteriorate together, the KB is a contributing factor.
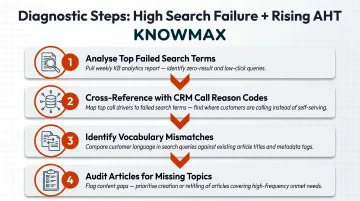
Pattern 1 — High Search Failure Rate + Rising AHT
What it signals: When agents search more without finding answers, they compensate with longer hold times and peer consultations. This combination points to one of two root causes:
- Agents are searching for topics the KB doesn't cover at all
- Content exists but isn't surfaced because article titles don't match how agents phrase queries
Diagnostic steps:
- Analyse top failed search terms from your KB analytics
- Cross-reference with call reason codes from your CRM
- Identify themes where search vocabulary doesn't match article titles
- Audit whether articles exist for these topics at all
Solution pathway: If content exists, improve article titles and metadata to match how agents phrase queries. If content doesn't exist, prioritise creation based on search volume and AHT impact.
Pattern 2 — Low Agent Adoption + High AHT
What it signals: When AHT exceeds targets but KB usage is low, the KB itself may not be the problem — but it's failing as a solution.
Agents are defaulting to faster workarounds (sticky notes, colleagues, memory) because the KB is too slow, too complex, or too untrustworthy to use during live calls.
The context-switching cost: If agents must leave their CRM or telephony interface to search the KB in a separate browser tab, they'll avoid it during time-sensitive interactions. The KB becomes a training resource rather than a real-time performance tool.
Solution pathway: Embedded KB tools within the agent desktop directly address this pattern. Platforms like Knowmax integrate with Salesforce, Zendesk, and Genesys to surface knowledge contextually within the agent's existing workflow — removing the friction that drives avoidance.
Pattern 3 — Improving Deflection + Stable or Declining CSAT
What it signals: When self-service usage rises but customer satisfaction doesn't follow, the KB is directing customers to answers that are present but not usable. Common causes:
- Incomplete steps that leave customers stuck mid-process
- Unclear language requiring specialist knowledge to interpret
- Missing visual context where images or diagrams would clarify text
- Correct but unusable formatting (long-form articles instead of step-by-step guides)
Solution pathway: This pattern requires a content quality audit, not just a volume or traffic review. Analyse which articles show high traffic but low resolution rates, then rewrite with visual aids, simplified language, or interactive decision trees.
Pattern 4 — High Content Freshness Score + Poor FCR
What it signals: When articles are being updated regularly but FCR isn't improving, the review process may be maintaining accuracy without improving usability. Articles are correct but agents can't act on them quickly during live calls.
The format problem: Long-form articles optimised for reading (paragraphs, detailed explanations) don't translate well to live call environments where agents need instant, actionable steps.
How to fix it: Structured formats like decision trees and step-by-step visual guides deliver stronger FCR results than paragraph-based articles. Convert high-traffic articles into guided workflows that agents can follow in real time.
Red Flags: Metric Combinations That Signal an Urgent KB Problem
Rising Ticket Volume for Topics That Already Have KB Articles
This is the clearest signal that existing content isn't doing its job. Either agents aren't finding it, customers aren't reading it, or the content doesn't resolve the issue.
Triage process:
- Check agent adoption data for those article categories first
- If adoption is low, the problem is discoverability or trust
- If adoption is high but tickets still rise, the content itself is ineffective
Declining Agent Contribution Rate Combined with an Aging Content Library
When agents stop flagging or updating articles and average article age increases, the KB enters a trust death spiral:
- Agents stop using content they suspect is outdated
- Agents stop flagging gaps because they're no longer engaged
- Content quality deteriorates further
- Trust erodes completely
Recovery pathway: Implement structured peer-review workflows and contribution incentives. Make it easy for agents to flag outdated content during calls, and ensure flagged content gets reviewed within 48-72 hours to rebuild trust.
Stagnant CSAT Despite KB Expansion
If you've significantly grown your KB content library but CSAT hasn't moved, the problem is usually omnichannel consistency. Agents and customer-facing channels are drawing from different or misaligned knowledge sources.
Watch for these signs:
- Customers report receiving different answers from self-service vs. live agents
- Chatbot resolutions contradict agent responses on the same issue
- CSAT scores vary widely by channel despite identical query types
That inconsistency destroys trust faster than any individual interaction can rebuild it.
What to do: Omnichannel KB consistency is the prerequisite before any content expansion pays off in CSAT. Knowmax delivers knowledge from one centralized base across agent desktop, self-service portal, chatbot, and mobile — so every channel gives the same answer, every time.
Frequently Asked Questions
What are the metrics for customer service efficiency?
Customer service efficiency is measured across three categories: agent productivity metrics (AHT, FCR), customer experience metrics (CSAT, NPS, call abandonment rate), and self-service metrics (deflection rate, self-service score). KB health metrics—search success, content freshness, and agent adoption—underpin all three by ensuring knowledge quality translates into operational outcomes.
What is a good self-service score for a knowledge base?
Using the Zendesk formula (KB sessions divided by ticket-submitting users), a baseline ratio is 4:1, while mature programmes reach 40:1. The gap between baseline and success represents a 10x improvement opportunity, with deflection rates of 20-40% considered top-performing across industries.
How do you measure the ROI of a knowledge base in a contact center?
ROI combines cost savings (AHT reduction × call volume, deflected tickets × cost per ticket) against KB investment costs, with FCR and ramp-time improvements adding further return. Reducing AHT by 30 seconds across 10,000 monthly calls at $8 per call, for instance, yields $480,000 in annual savings.
How does a knowledge base reduce Average Handle Time?
A KB reduces AHT by eliminating the time agents spend searching for answers during live calls. Through faster retrieval, in-workflow access, and AI-surfaced recommendations, agents resolve queries without switching contexts or consulting colleagues. The reduction comes from efficiency gains, not rushing agents, making it sustainable and scalable.
How often should knowledge base content be reviewed to maintain contact center performance?
Quarterly review is the baseline, with triggered reviews whenever product, policy, or process changes occur. High-impact articles warrant monthly review; general content can extend to 6-12 months. Content freshness score keeps this cadence visible and accountable.
Track KB health metrics alongside contact center outcome metrics, read them in pairs to diagnose root causes, and use platforms like Knowmax that connect both layers in unified analytics. When you can draw a direct line from search success to FCR improvement and from content freshness to CSAT gains, your knowledge base stops being a cost centre and becomes a measurable performance asset.